This is the first of a series of blog posts in which I will explain and demonstrate my final project for the course I am taking on Digital History. In this post I will discuss the origins and the purposes of my project. For my project, I decided to experiment with a method of sonification as a means to analyze and represent historical data. More specifically, the idea was to develop a way to represent the most frequent word usage in texts through audio. For lack of a better name, I have decided to call this project a Sonic Word Cloud.

Sonification refers to any method that is used to represent data through sound. So why would historians potentially want to sonify their historical data? Historian Shawn Graham has commented that by transforming data about the past into an aural form of representation, we make it new and unfamiliar. There is value in reshaping textual data into a form that we can approach with a new set of eyes (or ears), in order to analyze the data and ultimately find new patterns or meanings within it. This is true of visual representations, as exemplified by digital tools for textual analysis such as Voyant Tools that have by now become relatively commonplace. But it is perhaps even more true of sonic representations, which are even more unfamiliar to us at this point; as Graham notes, with forms of sonification “we begin to see elements of the data that our familiarity with visual modes of expression have blinded us to.” [1]
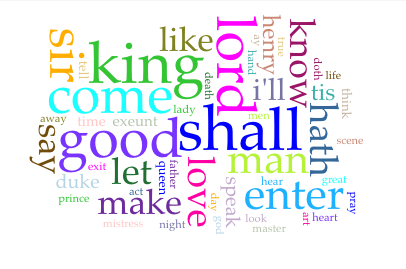
Word clouds are one visual form of textual representation that have become very common in text analysis tools as well as throughout the Internet as a whole. They take a text or a corpus of texts, determine the most frequently used words within it, and then represent these words clustered together with the size of each word corresponding to its relative frequency in the text. As a basic form of ‘distant reading,’ word clouds can help historians to quickly get a sense of the broad patterns of word usage within a given text or corpus.
However, word clouds also have significant limitations. First, they do not provide any indication of where words appear within the text. If, for instance, a word is used only in one small part of the text, then a word cloud could potentially give a misleading impression that the word is used throughout the text. Second, they do not offer any sense of how the words it represents are used in relation to each other within the text. Third, they do not provide a means to understand semantic meanings of different word usages; if a word is used in different contexts with different meanings (e.g., “mine” as a process of extracting ore, vs. an explosive device, or simply a possessive adjective), these meanings and usages will be grouped together as one word in the visual representation. Most pressingly, though, word clouds have attracted criticism for how they decontextualize textual data that other methodologies (such as n-grams or mapping) could illuminate more effectively. In a word cloud, the linear narrative of a text is reduced to a static representation that, some argue, perhaps obscures more than it reveals. [2]
Essentially, the question that drove me to plan my project was: how different or how useful might it be to represent the word usage data of a text linearly through sound? The website The Programming Historian features a lesson in which Shawn Graham demonstrates how to (among other things) use a Python package called MIDITime to convert different kinds of time-series data into MIDI files that can be mapped to instrumentation in music sequencing software. As an example, he shows how he converted topic modeling data from the entries of John Adam’s diaries into MIDI notation, which he then mapped to different instruments in Garageband. As Graham emphasizes, the choices of how to represent data through sound in this fashion are revealing of how we organize, privilege, reduce and transform information as historians. [3] However, the end result of this representation is not immediately intelligible to the listener; one may decide to, say, represent a topic concerning war in a text with the sound of piercing trumpets, but a listener has no means to truly understand the representation on its own without a separate guide. Therefore, this particular kind of sonification seems more useful as a kind of reflective process than as a practical method of textual representation or analysis.

My project takes inspiration from the Programming Historian lesson, but adapts and elaborates on it in other ways. The idea was as follows: to develop a method to take a given text, determine the top twenty-five words that appear within it, and convert the linear data of each time each word occurs in the text into MIDI notation with the MIDITime python package. From there, I would bring the MIDI files into music sequencing software, where they would then be mapped to samplers.

A sampler is a kind of digital instrument that can play and manipulate any audio file that is fed into it. Each sampler in the sequencer would then have a text-to-speech audio file of one of the top twenty five words loaded into it. The MIDI file for each word would then tell its corresponding sampler when to trigger the spoken word. With all of the samplers and MIDI data combined, we could then hear a sonic, linear representation of word usage for the most frequently used words in the text in a way that is (in theory) readily intelligible to the listener.
Theoretically, there could be significant advantages to representing textual data in this fashion as opposed to a visual word cloud. First, we would be able to hear linear, temporal patterns in word usage, getting a better sense of where these words appear within the narrative of the text. Second, with all of the data combined, we could be able to hear how different words are used in relation to each other in the text, and how these relations change over time.

Practically speaking, this would perhaps be nothing too new; websites such as Voyant Tools offer graphs that can visually represent broad trends in the relative frequency of different words throughout a text or corpus. However, one difference with this proposed sonification method would be that the listener could be able to hear not only the broad trends, but also the outliers in word usage. This could potentially aid in guiding closer reading of a text.
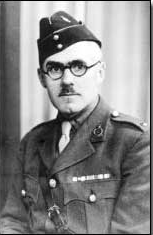
As the potential benefits of this kind of sonic representation are mainly found in its linearity, I thought that it could be particularly useful for representing and/or analyzing texts that have been written over a significant period of time, such as journals. In light of the present centennary of the First World War, I thought it fitting to select the 1916-1918 diaries of a British soldier named Robert Lindsay Mackay [4] to be the text that I would first test this method on. From there, I just needed to figure out how to make this concept a reality, in order to determine its viability as a means of textual analysis and/or public textual representation (i.e. in a public history context). In my next blog post, I will chronicle the beginning of this process and its challenges.
The other installments of this series can be found here:
Sonic Word Cloud Project Part 2: The Python Script
Sonic Word Cloud Project Part 3: Bringing it all Together in Ableton
Sonic Word Cloud Project Part 4: Conclusions
[1] Graham, Shawn. “The Sound of Data (a gentle introduction to sonification for historians).” http://programminghistorian.org/lessons/sonification.
[2] Harris, Jacob. “Word Clouds Considered Harmful.” NiemanLab (http://www.niemanlab.org/2011/10/word-clouds-considered-harmful/.
[3] Graham, “The Sound of Data (a gentle introduction to sonification for historians).”
[4] Mackay, Robert Lindsay. The Diaries of Robert Lindsay Mackay. http://www.firstworldwar.com/diaries/rlm.htm

3 thoughts on “Sonic Word Clouds: an Experiment with Data Sonification (Introduction)”